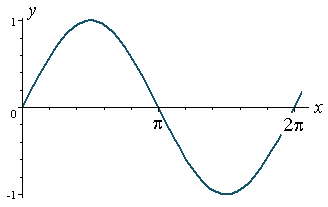
y= sin(x)
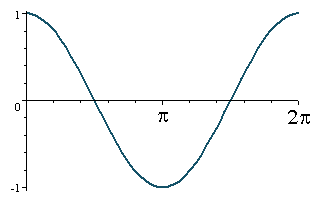
y= cos(x)
The domain of the sine and cosine functions is all real numbers, the range is [-1,1] and each function has a period of 2
Divide the period 2 to get 4 equal points: /2, , 3/2, and 2
Using Key Points to Sketch a Sine Curve:
y= 2 sin(x)
These key points will have twice the magnitude of the graph y= sin(x)
(0,0) (/2, 2) (, 0) (3/2, -2) (2, 0)

Amplitude and Period of Sine and Cosine Functions:
y= d + a sin(bx-c)
and
y= d + a cos(bx-c)
amplitude is half the distance between the maximum and minimum values of the function
ex. if y= 1/2 cos(x) the amplitude is 1/2, the maximum value is 1/2, and the minimum value is -1/2.
Divide one cycle,  , into 4 equal parts to get the key points:
(0, 1/2) (/2, 0) (, -1/2) (3/2, 0) (2, 1/2)
Period= 
For the rest of the translations of sine and cosine curves, consider reviewing the transformations studied in section 1.3 in our blog:
y= f(x)
y= f(x)+2 shifts up 2
y= f(x+2) shifts left 2
y= f(x-2) shifts right 2
y= 2f(x) vertically stretched
y= (2x) horizontally compressed
y= -f(x) reflects in y-axis
y= f(-x) reflects in x-axis
No comments:
Post a Comment