4.6 CSC, SEC, COT, and TAN Graphs
Let's start with the graph of
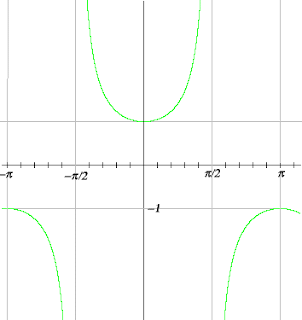
The graph of  looks like this:
x-intercepts we need to set the numerator of the function,  , equal to zero. We know that 1 cannot be equal to zero, so there will be no x-intercepts. The asymptotes of the graph are
  , and
, and  , because the vertical asymptotes can be found by setting the denominator equal to zero, in this case
  . By looking at the Unit Circle we can find out where
  is zero, wherever the y-coordinate (which is equal to
  ), is zero.
Now let's move on to finding the graph of a  function.
  is equal to
  .
.
The graph of  looks like this:
By now you can probably see how this works.  and
and  functions work much the same. Since
  functions are the basis of
  functions, let's look at
  first.
The graph of a  function looks like this:
You can probably guess how we found the x-intercepts and the vertical asymptotes. X-intercepts are found when the numerator is set equal to zero, since  is equal to
  , we can find the x-intercepts by finding out when
  equals zero by looking at the unit circle.
  equals zero at
  and
and  , and so those are the x-intercepts. We do the same thing for finding the vertical asymptotes, except instead of looking at the numerator we look at where the denominator equals zero. The denominator (
  ) is zero at
  , and
, and  .
.
The  functions go the opposite way of
  functions.
  functions are
  . Here's a graph of a
  function:
As we can see, the graph goes down, instead of up like the  does. X-intercepts and vertical asymptotes are found exactly like those of all other functions- with the numerator and denominator.
An important thing to recognize about  and
and  functions is that their period is shorter than those
of  and
and  functions. The period of
  and
and  functions is only
  , not
, not  . The formula is as follows:
All of the aforementioned functions undergo transformations. They may be stretched horizontally, or vertically. Or they may be compressed by a certain factor or shifted up/down a certain number. This all depends on what numbers affect the function.
Here's the basic formula of a function:  \right ]+d) . 'trig' in this case is a placeholder for any of the trigonometric functions, (
. 'trig' in this case is a placeholder for any of the trigonometric functions, ( ,
,  ,
,  ,
,  ,
,  and
and  ).
).
Here is how it works:
- The value of a is the amplitude of the function. This means it tells us by how much the function is stretched or compressed vertically
- The value of b dictates the horizontal stretch/compression (remember that the effect it has becomes counter-intuative. If the value of b is greater than one, the curve will horizontally compress. If the value is less than one, it will horizontally stretch.)
- The value of c tells us if, and what, the horizontal shift is. This means that your graph may be moved to the left or right by whatever value c is.
- The value of d determines the vertical shift. This means that your graph may be moved up or down by whatever value d is.


No comments:
Post a Comment